So, now that I’ve been in the lab for a little over a week, I have a better idea of what my project is going to be. I’m going to be doing an experiment trying to find the limit of what we can and cannot see - the “contrast sensitivity” of humans. To do this, I’ll be running an experiment (which I’ll write in MATLAB) seeing what the lowest contrast is where people can still see a stimulus. Using the data from this experiment, I will come to a conclusion, and map the contrast sensitivity function. My overarching questions for this experiment will be What are the limits of sight? and What shape is the contrast sensitivity function?.
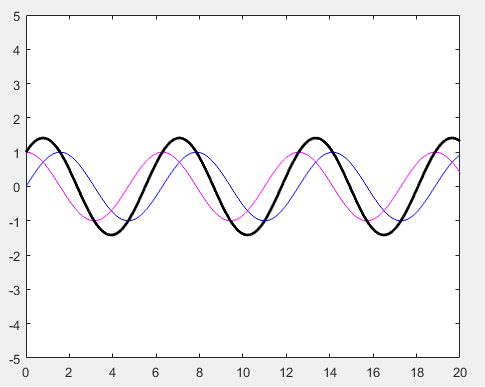
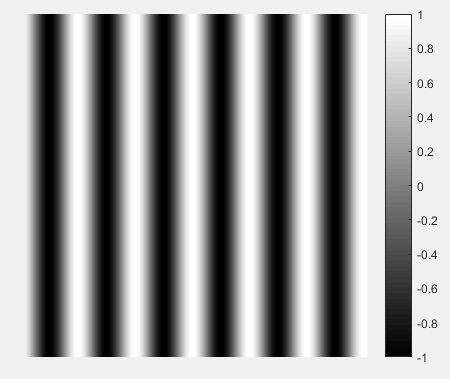
Another “product” from this internship will be the skills and knowledge I will learn by doing the project. Things like neuroscience, both technically, and philosophically, MATLAB, and Fourier mathematics, including trigonometry, and calculus. To get these skills, as I’ve mentioned, I’ve been doing a lot of reading, as well as doing practice in MATLAB. For instance, I made some graphs using MATLAB: a sine wave (blue), a cosine wave (pink), and then added them together (black with a heavier line weight). I also made a luminance grating, which is essentially a 2D picture, where luminance changes in one direction. It is 2D, but the values of the numbers/colors only change in one direction. If you pick a point on the graph and follow it horizontally, the values of the numbers/colors will change, but if you follow it vertically, they won’t change at all. The luminance grating that I made is a sine wave, so it oscillates between -1 and 1 gradually, creating the blurry effect.
Another “product” from this internship will be the skills and knowledge I will learn by doing the project. Things like neuroscience, both technically, and philosophically, MATLAB, and Fourier mathematics, including trigonometry, and calculus. To get these skills, as I’ve mentioned, I’ve been doing a lot of reading, as well as doing practice in MATLAB. For instance, I made some graphs using MATLAB: a sine wave (blue), a cosine wave (pink), and then added them together (black with a heavier line weight). I also made a luminance grating, which is essentially a 2D picture, where luminance changes in one direction. It is 2D, but the values of the numbers/colors only change in one direction. If you pick a point on the graph and follow it horizontally, the values of the numbers/colors will change, but if you follow it vertically, they won’t change at all. The luminance grating that I made is a sine wave, so it oscillates between -1 and 1 gradually, creating the blurry effect.
 |  |
To make this project a success, I will definitely need support from my mentor, as well as some other people in the lab (with different specialties). I will also be working with another intern (from Columbia University) who arrived at the lab at the same time as me. She and I will most likely be working on a similar project, though she is staying at the lab for longer than me. We will still need to know the same information, and have already become valuable resources for each other.
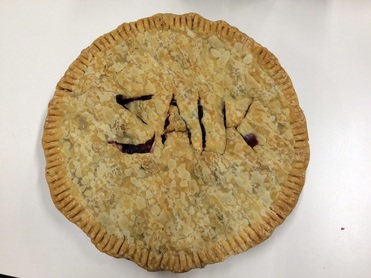
A side note: I brought in my homemade new-guy pie!
A side note: I brought in my homemade new-guy pie!
 RSS Feed
