Infographic
Each person in my class also had to make an infographic, based on their group roles. Land Manager (Evan), Farmer (Carson), and End Water User (Kirsten). To do this, we first had to think of 15 things we (as people in our roles) did to watersheds, both positively and negatively. Here is what I came up with:
|
Positive Impacts:
|
Negative Impacts:
|
After that, we had to chose 5 things in each category (I italicized them) to use for our infographics. Here is what the first draft of my infographic looks like:
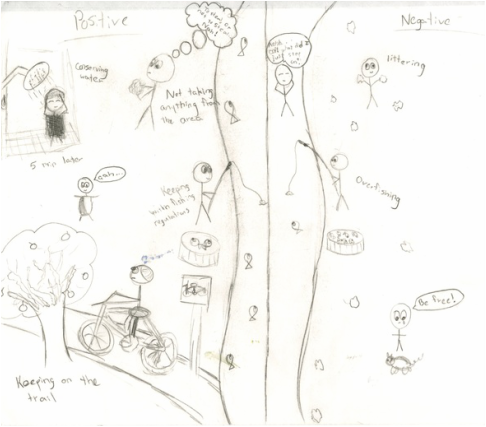
The main critique I got was to have less of a focus on people, so I removed most of them.
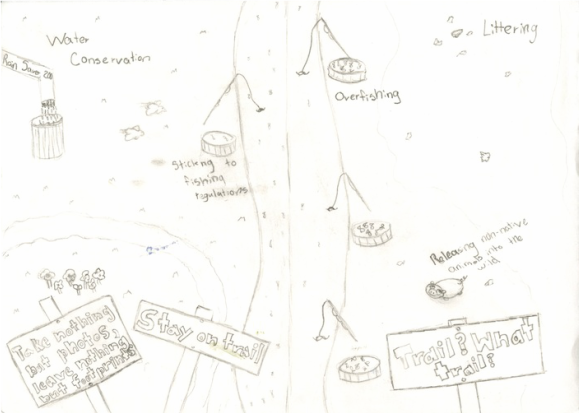
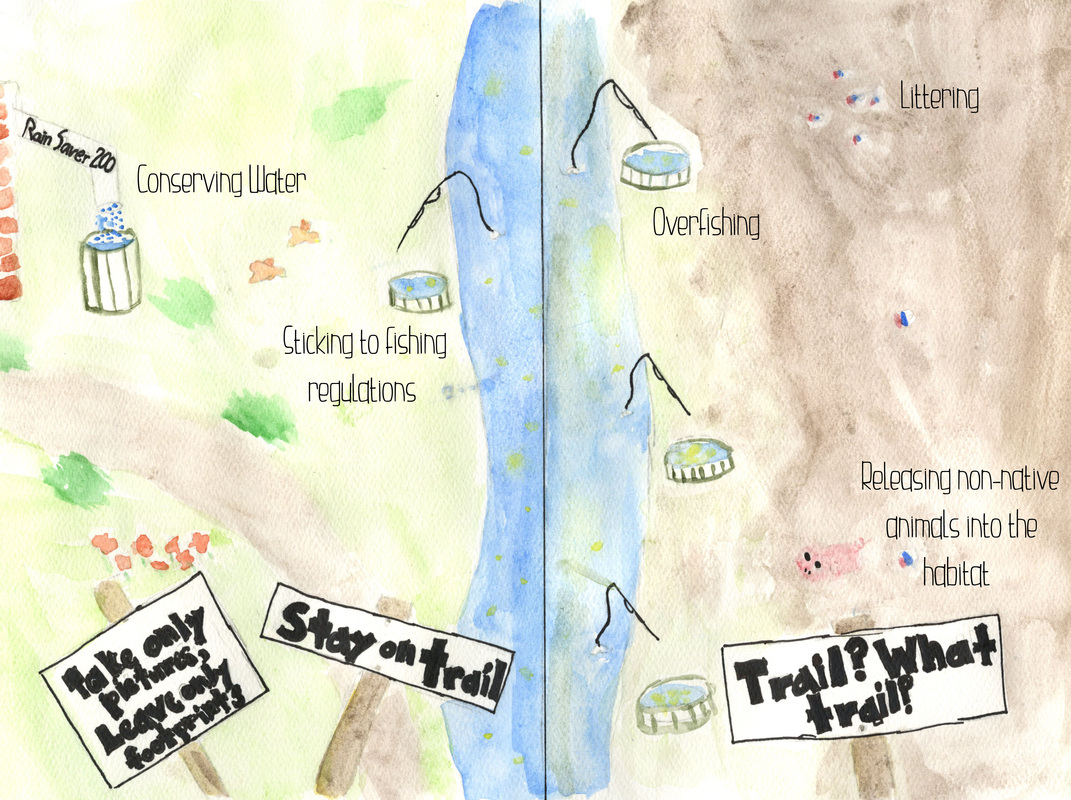
And here is the final draft:
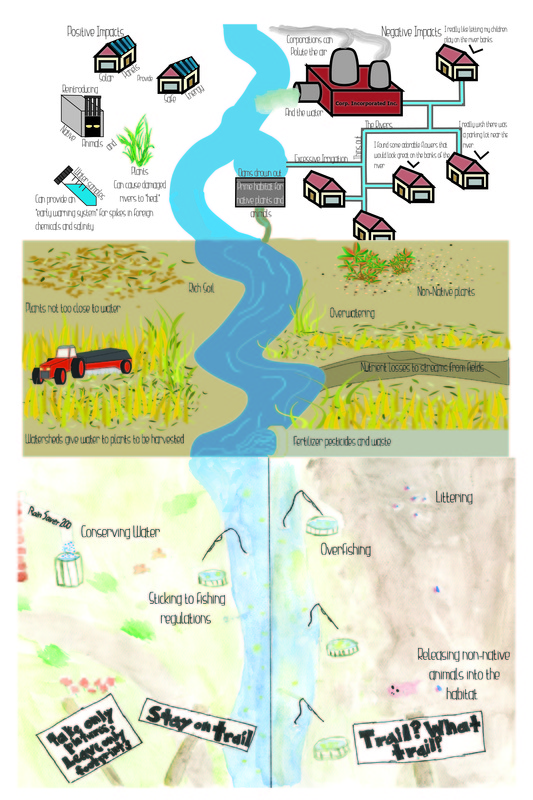
Finally, here is the final page. The order of who did which infographic (from top to bottom) is Evan, Carson, then me.